
Menu
Charts and Graphs
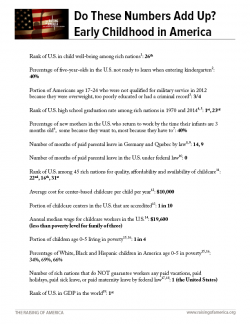 |
Do These Numbers Add Up? Early Childhood in AmericaHow are we doing in caring for our children? Are we setting our children—and our nation—up for success? |
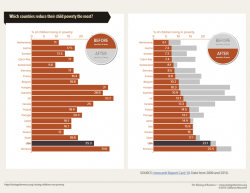 |
Reducing Child Poverty - Before and AfterMany nations use government assistance and tax programs to raise children and families out of poverty. To see how much these transfers and taxes matter, compare the child poverty rates BEFORE and AFTER government benefits. Which countries end up with the lowest percentage of their children living in poverty? And which the highest? |
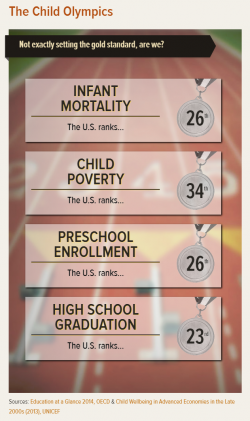 |
The Child Olympics (PDF)This PDF takes you through the screens of the Child Olympics activity. We see that the United States performed poorly in the latest Child Olympics - in infant mortality, child poverty, preschool enrollment and high school graduation. |
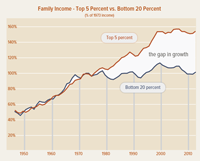 |
The Family Income GapFamily income earned by the top 5% and the bottom 20% grew in tandem from the 1940s to the 1970s. But since then, income for the top 5% has grown and grown and grown while income for the bottom 20% has stagnated. |
 |
The Income-Achievement GapsThe gap in achievement scores between rich kids and poor kids has grown just as fast as the income gap. |
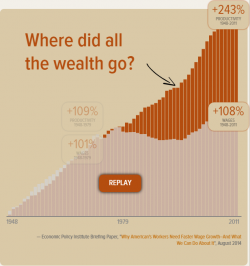 |
Where Did the Wealth Go? (PDF)This PDF displays the screens from this activity. From 1948 to 1979, wages in America matched its explosive growth in productivity. But since then, productivity has risen dramatically and wages have barely moved at all. |
Produced by California Newsreel with Vital Pictures
Site design by ![]() with Silent K Designs
with Silent K Designs
- Produced by California Newsreel with Vital Pictures
- |
- Press Kit
- |
- Contact
- © 2017 California Newsreel
- |
- Privacy Policy & Terms of Use
- |
- Site design by
 with Silent K Designs
- Produced by California Newsreel with Vital Pictures
- |
- Press Kit
- |
- Contact
- © 2017 California Newsreel
- |
- Privacy Policy & Terms of Use
- Site design by
- with Silent K Designs